Welcome to the Hardcore Husky Forums. Folks who are well-known in Cyberland and not that dumb.
Numbers, math, facts, etc.
Comments
-
I’m not understanding the messageGrundleStiltzkin said: -
Shit, I was counting on you for interpretation.LoneStarDawg said:
I’m not understanding the messageGrundleStiltzkin said: -
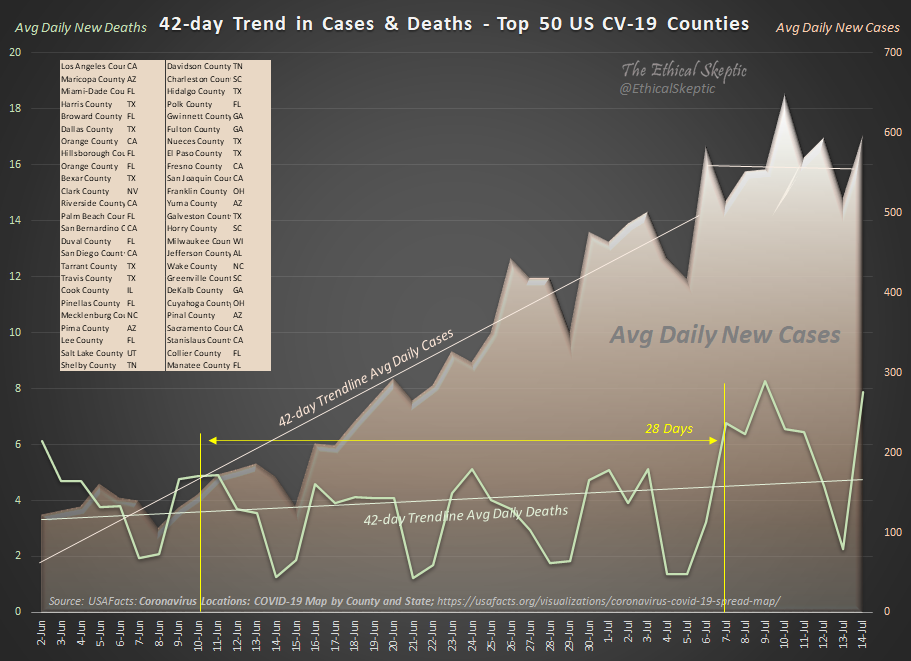
I think the implication of these is that these are the 50 "worst" counties in the country, but the average new cases and average deaths are about half of what they were last week for the "worst" counties.LoneStarDawg said:
I’m not understanding the messageGrundleStiltzkin said:
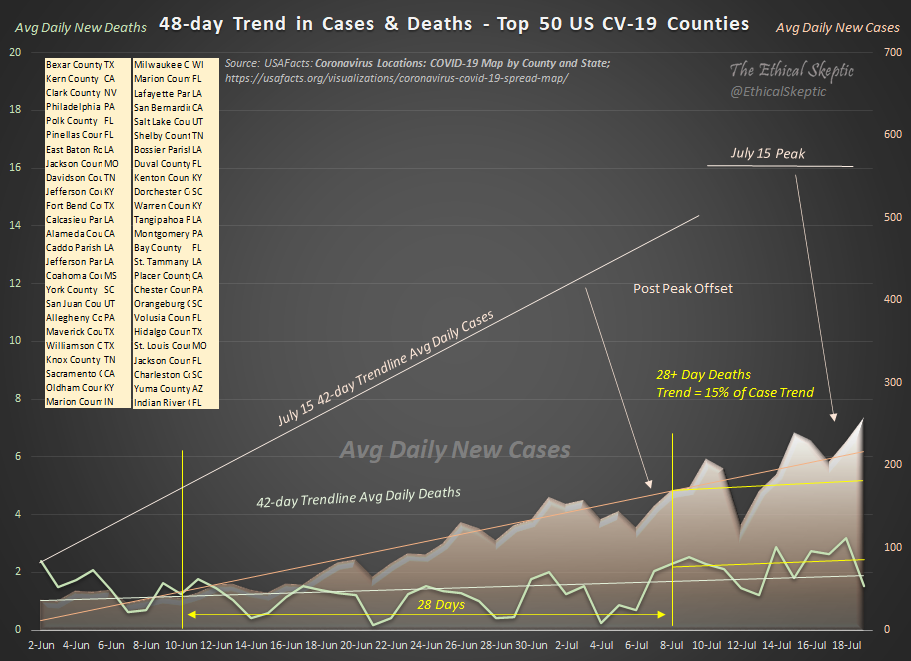
Not really sure that these charts are comparable, though, as the list of the "worst" counties changed, so population size differences would need to be accounted for? Lots of large counties (i.e., LA, OC, etc.) are in the first list but not the second.
-
I find that some of these charts are like maff
-
this thread reminds me of the North Korea one...
-
Texas hospital data...
Blue = admitted for Covid symptoms
Red = admitted for something else but either tested pos or presumed pos, no covid like illness
Half of all covid19 coded inpatients in Texas show no covid like illness
The growth rate for NonC19 admittance is ~0% since June 18 to July 12
Im hearing InStyle Fashion model Fauci praised NY and Coumo covid response... makes sense!
-
It’s not clearly described for sure, not his best work.LesGrossman said:
I think the implication of these is that these are the 50 "worst" counties in the country, but the average new cases and average deaths are about half of what they were last week for the "worst" counties.LoneStarDawg said:
I’m not understanding the messageGrundleStiltzkin said:
Not really sure that these charts are comparable, though, as the list of the "worst" counties changed, so population size differences would need to be accounted for? Lots of large counties (i.e., LA, OC, etc.) are in the first list but not the second.
What I see is the recent actuals for both deaths and cases are quite below the backwards looking moving average trend, which implies that some big data has dropped off and the moving average trend is going to shift down going forward. 48 days ago was like a week after the peak of the riots. Could be reading it wrong though.
-