Welcome to the Hardcore Husky Forums. Folks who are well-known in Cyberland and not that dumb.
Weird trend on the 30 year interest rate...

HoustonHusky
Member Posts: 6,026
in Tug Tavern
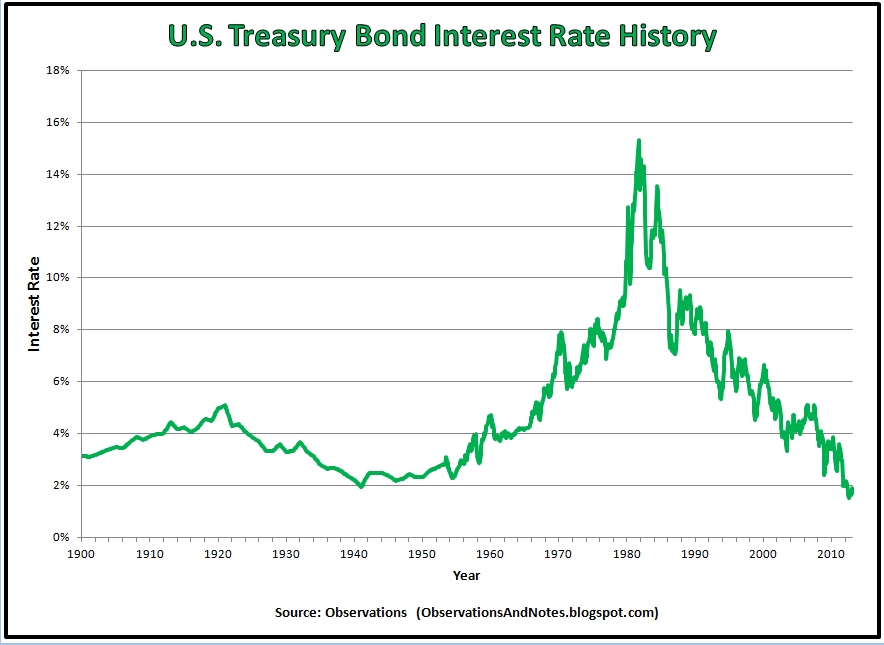
A friend was showing it to me at work today...I'm too lazy to pull up the Reuters Chart of it but you can see it in this:

Basically, if you zoom in from 1987 (the crash then) to now on the 30-year rate it has followed an amazingly tight straight channel downward...and its getting to the point where that channel can't go down much further. You can add some comments about it being the point at which the Fed started trying to fix everything, but its kinda a frightening chart whatever your views on the Fed are...and moreso when you realize it has to break out of that channel sometime soon.

Basically, if you zoom in from 1987 (the crash then) to now on the 30-year rate it has followed an amazingly tight straight channel downward...and its getting to the point where that channel can't go down much further. You can add some comments about it being the point at which the Fed started trying to fix everything, but its kinda a frightening chart whatever your views on the Fed are...and moreso when you realize it has to break out of that channel sometime soon.
Comments
-
I won't believe it until it's on Wikipedia
-
Negative rates and the end of capitalism as we know it.
-
Crazy!
-
Why?
-
If you are getting into ridiculous interest rate theories. At least reference zero hedge.
-
I didn't know a plot of data of 30 year interest rates with channel lines (I'm guessing you don't know what channel lines are...) constitutes a "theory" now...your "Intelligence" continues to shine bright around here.2001400ex said:If you are getting into ridiculous interest rate theories. At least reference zero hedge.
And it wasn't on zerohedge or any other site that I'm aware of... -
As a dumb red, I don't know what any of this means. Can someone explain how these rates going down for so long can fuck us? as a cuntry? TIA
-
Maybe a PM to @IrishDawg22 is in order? I here he has this place dialed in.HoustonHusky said:
I didn't know a plot of data of 30 year interest rates with channel lines (I'm guessing you don't know what channel lines are...) constitutes a "theory" now...your "Intelligence" continues to shine bright around here.2001400ex said:If you are getting into ridiculous interest rate theories. At least reference zero hedge.
And it wasn't on zerohedge or any other site that I'm aware of... -
deflation.TheGlove said:Why?
-


