Let's talk labor participation rates


http://www.bls.gov/opub/ted/2014/mobile/ted_20140106.htm
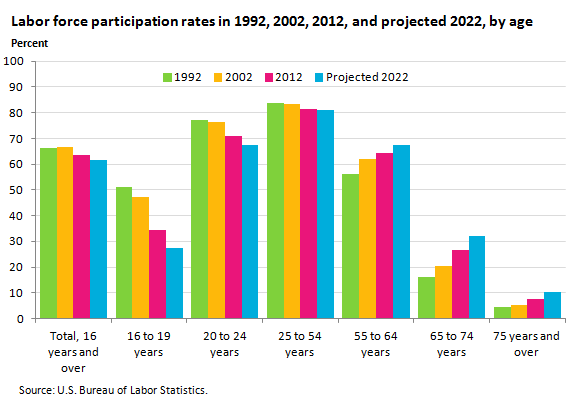
This is from sane source that others have quoted for that stat. So yes it's true that 25-54 year olds the labor percentage has decreased. But look at 55 plus, every category is higher. Do you think that factors into it? Then do you want to discuss why labor participation is higher in those age groups?
Comments
-
It means people aren't able to retire anymore and need to continue to work, while cashing in social security checks, to stay alive.2001400ex said:Here's another way your news source is lying to you. How many times have I heard that labor participation rates are at levels back in the 70s and therefore unemployment is way higher than quoted, and therefore or economy is shitty.

http://www.bls.gov/opub/ted/2014/mobile/ted_20140106.htm
This is from sane source that others have quoted for that stat. So yes it's true that 25-54 year olds the labor percentage has decreased. But look at 55 plus, every category is higher. Do you think that factors into it? Then do you want to discuss why labor participation is higher in those age groups?
This isn't a good thing. -
Agreed, and what are the root causes of that.whatshouldicareabout said:
It means people aren't able to retire anymore and need to continue to work, while cashing in social security checks, to stay alive.2001400ex said:Here's another way your news source is lying to you. How many times have I heard that labor participation rates are at levels back in the 70s and therefore unemployment is way higher than quoted, and therefore or economy is shitty.

http://www.bls.gov/opub/ted/2014/mobile/ted_20140106.htm
This is from sane source that others have quoted for that stat. So yes it's true that 25-54 year olds the labor percentage has decreased. But look at 55 plus, every category is higher. Do you think that factors into it? Then do you want to discuss why labor participation is higher in those age groups?
This isn't a good thing. -
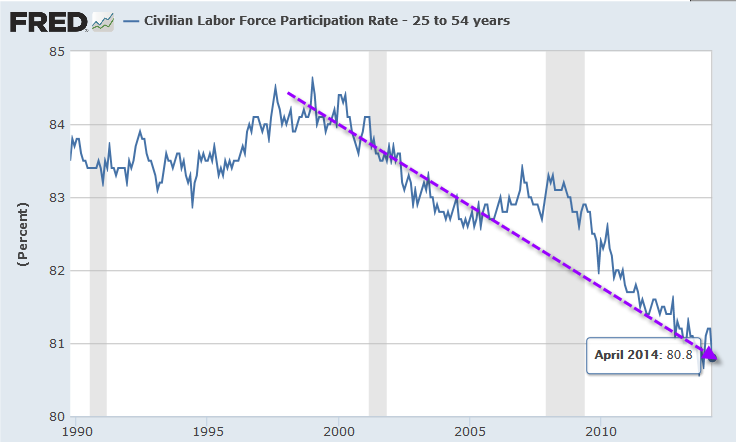
Still bringing up topics you don't understand the info on. A couple other graphs:
Series Id: LNS12300060
Seasonally Adjusted
Series title: (Seas) Employment-Population Ratio - 25-54 yrs.
Labor force status: Employment-population ratio
Type of data: Percent or rate
Age: 25 to 54 years


(male participation rate now lowest in history of the data)
Robust recovery we got going on there...
Start *gurgling* -
Decreasing wages, exponentially higher healthscare costs2001400ex said:
Agreed, and what are the root causes of that.whatshouldicareabout said:
It means people aren't able to retire anymore and need to continue to work, while cashing in social security checks, to stay alive.2001400ex said:Here's another way your news source is lying to you. How many times have I heard that labor participation rates are at levels back in the 70s and therefore unemployment is way higher than quoted, and therefore or economy is shitty.

http://www.bls.gov/opub/ted/2014/mobile/ted_20140106.htm
This is from sane source that others have quoted for that stat. So yes it's true that 25-54 year olds the labor percentage has decreased. But look at 55 plus, every category is higher. Do you think that factors into it? Then do you want to discuss why labor participation is higher in those age groups?
This isn't a good thing. -
Yes, there are more Suzy home bitches now than there were 50 years ago.HoustonHusky said:Still bringing up topics you don't understand the info on. A couple other graphs:
Series Id: LNS12300060
Seasonally Adjusted
Series title: (Seas) Employment-Population Ratio - 25-54 yrs.
Labor force status: Employment-population ratio
Type of data: Percent or rate
Age: 25 to 54 years


(male participation rate now lowest in history of the data)
Robust recovery we got going on there...
Start *gurgling*
Again, use meaningful data, not just cherry pick 25-54 years old. For fucks sake. -
Obama.2001400ex said:
Agreed, and what are the root causes of that.whatshouldicareabout said:
It means people aren't able to retire anymore and need to continue to work, while cashing in social security checks, to stay alive.2001400ex said:Here's another way your news source is lying to you. How many times have I heard that labor participation rates are at levels back in the 70s and therefore unemployment is way higher than quoted, and therefore or economy is shitty.

http://www.bls.gov/opub/ted/2014/mobile/ted_20140106.htm
This is from sane source that others have quoted for that stat. So yes it's true that 25-54 year olds the labor percentage has decreased. But look at 55 plus, every category is higher. Do you think that factors into it? Then do you want to discuss why labor participation is higher in those age groups?
This isn't a good thing.
Duh. -
It's been a while since I took a college stats class, but this growth does not appear to be exponential.Fire_Marshall_Bill said:
Decreasing wages, exponentially higher healthscare costs2001400ex said:
Agreed, and what are the root causes of that.whatshouldicareabout said:
It means people aren't able to retire anymore and need to continue to work, while cashing in social security checks, to stay alive.2001400ex said:Here's another way your news source is lying to you. How many times have I heard that labor participation rates are at levels back in the 70s and therefore unemployment is way higher than quoted, and therefore or economy is shitty.

http://www.bls.gov/opub/ted/2014/mobile/ted_20140106.htm
This is from sane source that others have quoted for that stat. So yes it's true that 25-54 year olds the labor percentage has decreased. But look at 55 plus, every category is higher. Do you think that factors into it? Then do you want to discuss why labor participation is higher in those age groups?
This isn't a good thing.
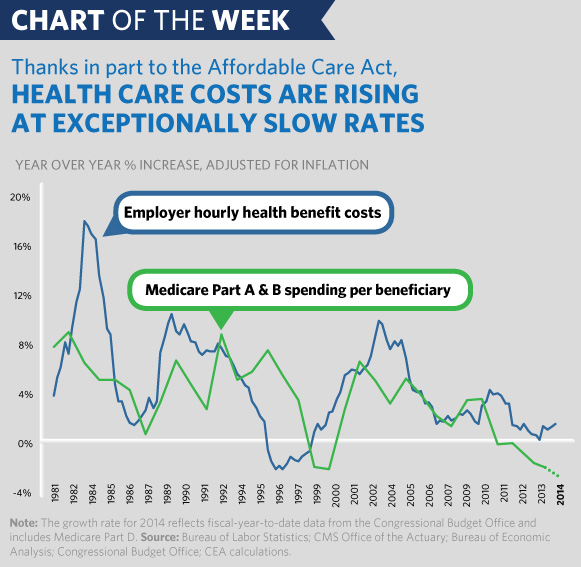
http://m.whitehouse.gov/blog/2014/09/05/chart-week-health-care-costs-rising-exceptionally-slow-rates
-
2001400ex said:
It's been a while since I took a college stats class, but this growth does not appear to be exponential.Fire_Marshall_Bill said:
Decreasing wages, exponentially higher healthscare costs2001400ex said:
Agreed, and what are the root causes of that.whatshouldicareabout said:
It means people aren't able to retire anymore and need to continue to work, while cashing in social security checks, to stay alive.2001400ex said:Here's another way your news source is lying to you. How many times have I heard that labor participation rates are at levels back in the 70s and therefore unemployment is way higher than quoted, and therefore or economy is shitty.

http://www.bls.gov/opub/ted/2014/mobile/ted_20140106.htm
This is from sane source that others have quoted for that stat. So yes it's true that 25-54 year olds the labor percentage has decreased. But look at 55 plus, every category is higher. Do you think that factors into it? Then do you want to discuss why labor participation is higher in those age groups?
This isn't a good thing.
Yep. You couldn't calculate a standard deviation if it bit you in the ass. -
d2d said:
Nice work.2001400ex said:
It's been a while since I took a college stats class, but this growth does not appear to be exponential.Fire_Marshall_Bill said:
Decreasing wages, exponentially higher healthscare costs2001400ex said:
Agreed, and what are the root causes of that.whatshouldicareabout said:
It means people aren't able to retire anymore and need to continue to work, while cashing in social security checks, to stay alive.2001400ex said:Here's another way your news source is lying to you. How many times have I heard that labor participation rates are at levels back in the 70s and therefore unemployment is way higher than quoted, and therefore or economy is shitty.

http://www.bls.gov/opub/ted/2014/mobile/ted_20140106.htm
This is from sane source that others have quoted for that stat. So yes it's true that 25-54 year olds the labor percentage has decreased. But look at 55 plus, every category is higher. Do you think that factors into it? Then do you want to discuss why labor participation is higher in those age groups?
This isn't a good thing.
Yep. You couldn't calculate a standard deviation if it bit you in the ass. -
Cherry pick 25-54 year olds? Are we to think that a rise in employment of 55+ year olds is good for the economy? I'm sorry, but more people saying "hello" to me when I walk into Walmart and Costco doesn't move the needle much.2001400ex said:
Yes, there are more Suzy home bitches now than there were 50 years ago.HoustonHusky said:Still bringing up topics you don't understand the info on. A couple other graphs:
Series Id: LNS12300060
Seasonally Adjusted
Series title: (Seas) Employment-Population Ratio - 25-54 yrs.
Labor force status: Employment-population ratio
Type of data: Percent or rate
Age: 25 to 54 years


(male participation rate now lowest in history of the data)
Robust recovery we got going on there...
Start *gurgling*
Again, use meaningful data, not just cherry pick 25-54 years old. For fucks sake.
The biggest problem is the incentive to work. 25-54 year olds are working less and less, because they don't have to. Through "Entitlement", the government has made it easier and easier for lazy people to make a living staying at home and pumping out kids. But no worries, in America it's socially acceptable for people who want to make something of themselves and work 60 hour weeks to support these morons. Heaven forbid Leroy and Charlene don't get their monthly welfare (errrrrrrrrrrrr) easily convertible beer and smokes money.


