Washington State Democrats meet in secret to plot an income tax
Comments
-
-
Dude, there's nothing in your quoted post.
-
Okay okay, I didn't realize that was a link. Fuck Vanilla
-
I could go on
-
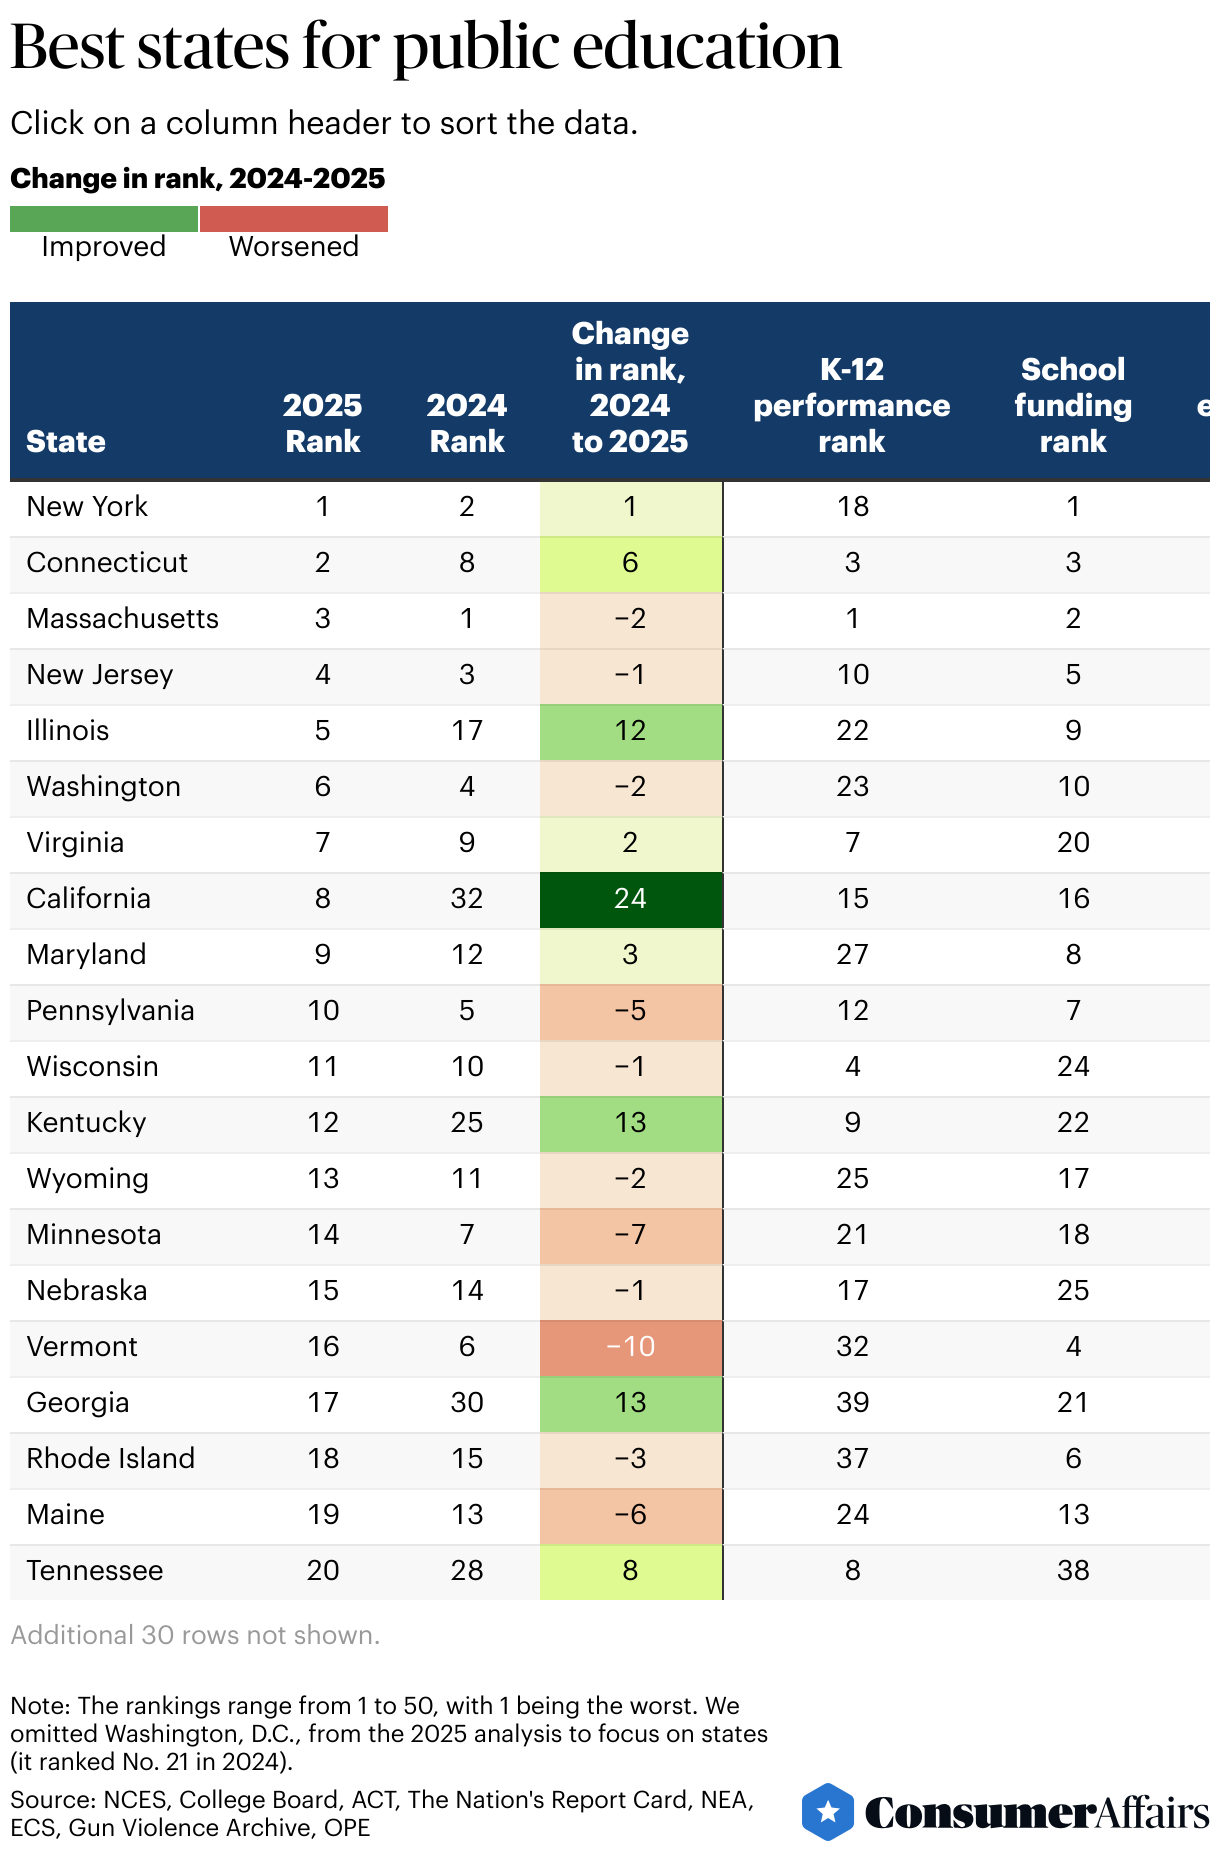
Wouldn't it stand to reason that the #10 school funding rank should also have the #10 performance rank?
Do less with more - the State of Washington.
-
Others receiving votes

-
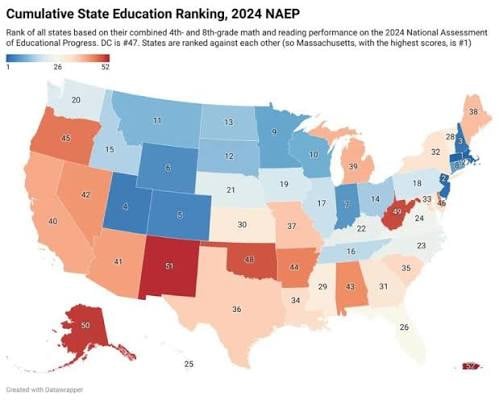
Top 25
-
Sure. That's an argument I can get behind.
-
Doesn’t sound secret
-
Looks like you cutoff higher education. You wouldn't mislead your side of the argument, surely?
Here's the scoring for your so-called rebuttal:
- K-12 performance (30 points): The K-12 performance score is based on five metrics: public high school four-year graduation rate (2021-2022) (10 points), average SAT score (2024) (5 points), average ACT score (2024) (5 points) and average NAEP reading and math scores for fourth and eighth graders (2024) (5 points each). Data was sourced from the National Center for Education Statistics, College Board, ACT, The Nation’s Report Card and Wisevoter (2022) (graduation rates for Oklahoma and New Mexico only).
- School funding and resources (30 points): The school funding and resources score is based on four metrics: expenditure per K-12 student (2023-2024) (7.5 points), K-12 student-to-teacher ratio (2023-2024) (7.5 points), average K-12 public school teacher salary (2023-2024) (7.5 points) and percentage of K-12 public school teachers with advanced degrees (2020-2021) (7.5 points). Data comes from the National Education Association, the National Center for Education Statistics and Ballotpedia (2022) (student-to-teacher ratio for Wyoming only).
- Higher education quality (30 points): The higher education quality score is based on seven metrics: four-year public college graduation rate (2017) (3 points), two-year public college graduation rate (2020) (3 points), retention rate at public colleges (2023) (6 points), average in-state tuition and fees for four-year public colleges (2024-2025) (3 points), average in-district tuition and fees for two-year public colleges (2024-2025) (3 points), state/local funding per full-time college student (2022-2023) (6 points) and state grant aid per full-time undergraduate student (2022-2023) (6 points). Data was sourced from the National Center for Education Statistics, College Board, EducationData.org (average in-district tuition and fees for two-year colleges in Alaska only) and SHEEO (state grant aid per full-time undergraduate student for Wyoming only).
- Safety (10 points): The safety score is based on three metrics: whether the state has a school safety board (2022) (4 points), the number of gun violence incidents at all schools per 100,000 students (2024-2025) (3 points) and the number of reported criminal offenses at colleges per 10,000 students (2023) (3 points). Data comes from Education Commission of the States, the Gun Violence Archive and the Office of Postsecondary Education.
One could argue that anywhere from 40-70% of that is irrelevant to the discussion at hand.
In any case, I do think this is a pointless debate until there's any form of agreed upon criteria for what constitutes "better" in this context. What isn't up for debate is that Washington test scores (and most other blue states) are trending downward and some others, despite the usual stereotypes, are trending upward